Q?Bus begins its
journey around
Panama
Picture
the unseen
A community of scientists put microbial ecosystems back together again using anvi’o
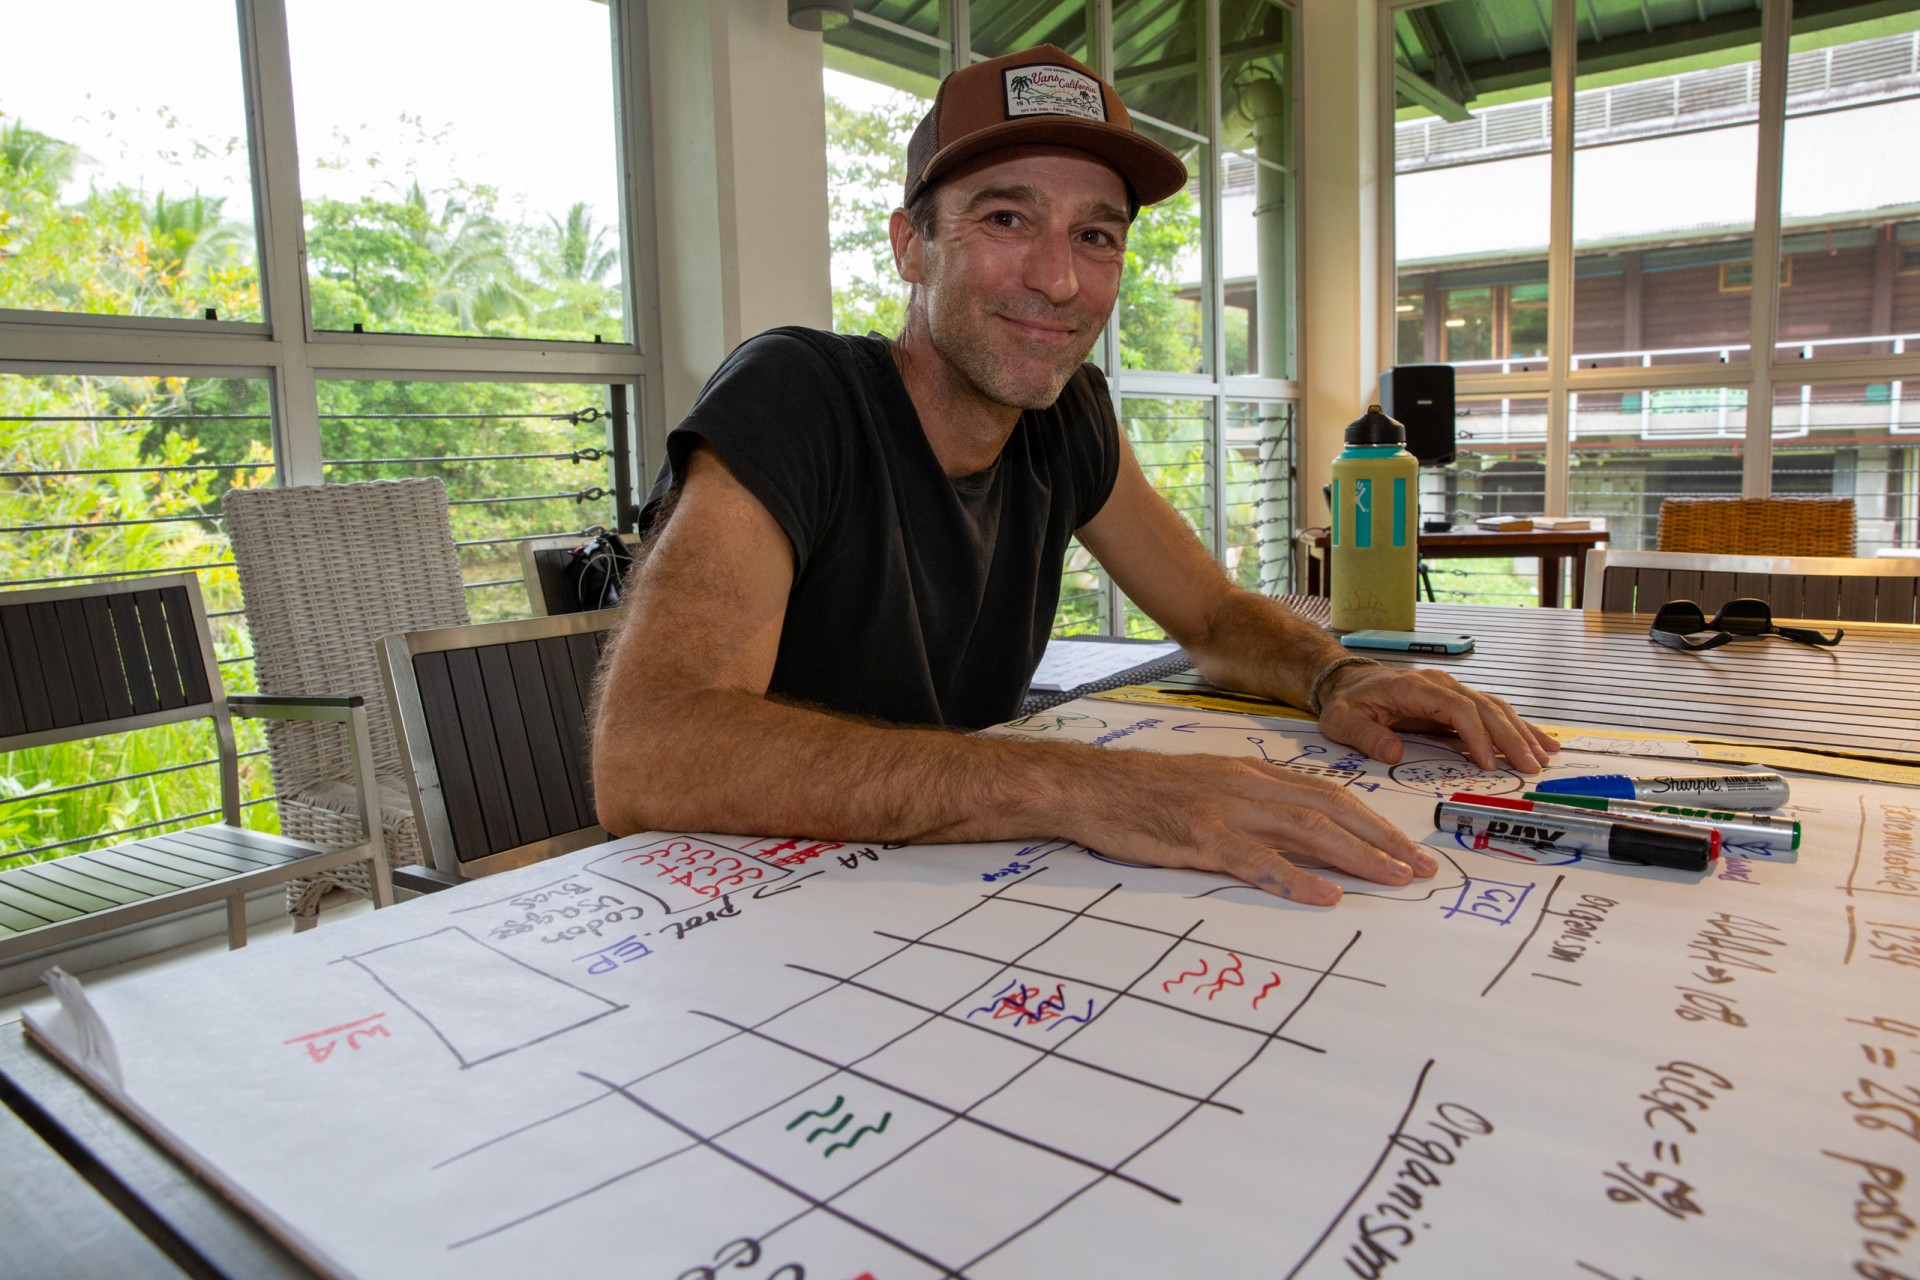
Post-doc Jarrod Scott is an active contributor to anvi’o, a set of computational tools to visualize microbial communities.
If a magic hand could weigh all ocean life, microbes would account for ninety percent of the total biomass. Our health and the health of the environment depend on communities of life too small to see. A single drop of seawater may contain 10 million viruses and a million bacteria. More than 1.5 trillion bacteria inhabit one person’s skin. Smithsonian researchers are using an advanced computational and visualization infrastructure to picture these tiny universes within the world’s most biodiverse ecosystems.
Jarrod J. Scott, Moore Foundation-sponsored post-doctoral fellow at the Smithsonian Tropical Research Institute (STRI) and his colleagues are like emergency room docs who urgently need to know whether a coral reef is healthy or sick. To investigate the microorganisms that live in different environments, they work with a clever team, led by A. Murat Eren (Meren) an Assistant Professor at the University of Chicago who developed a completely open-source, community driven set of tools called anvi’o to process, analyze, and visualize ‘omics data from microbial communities.
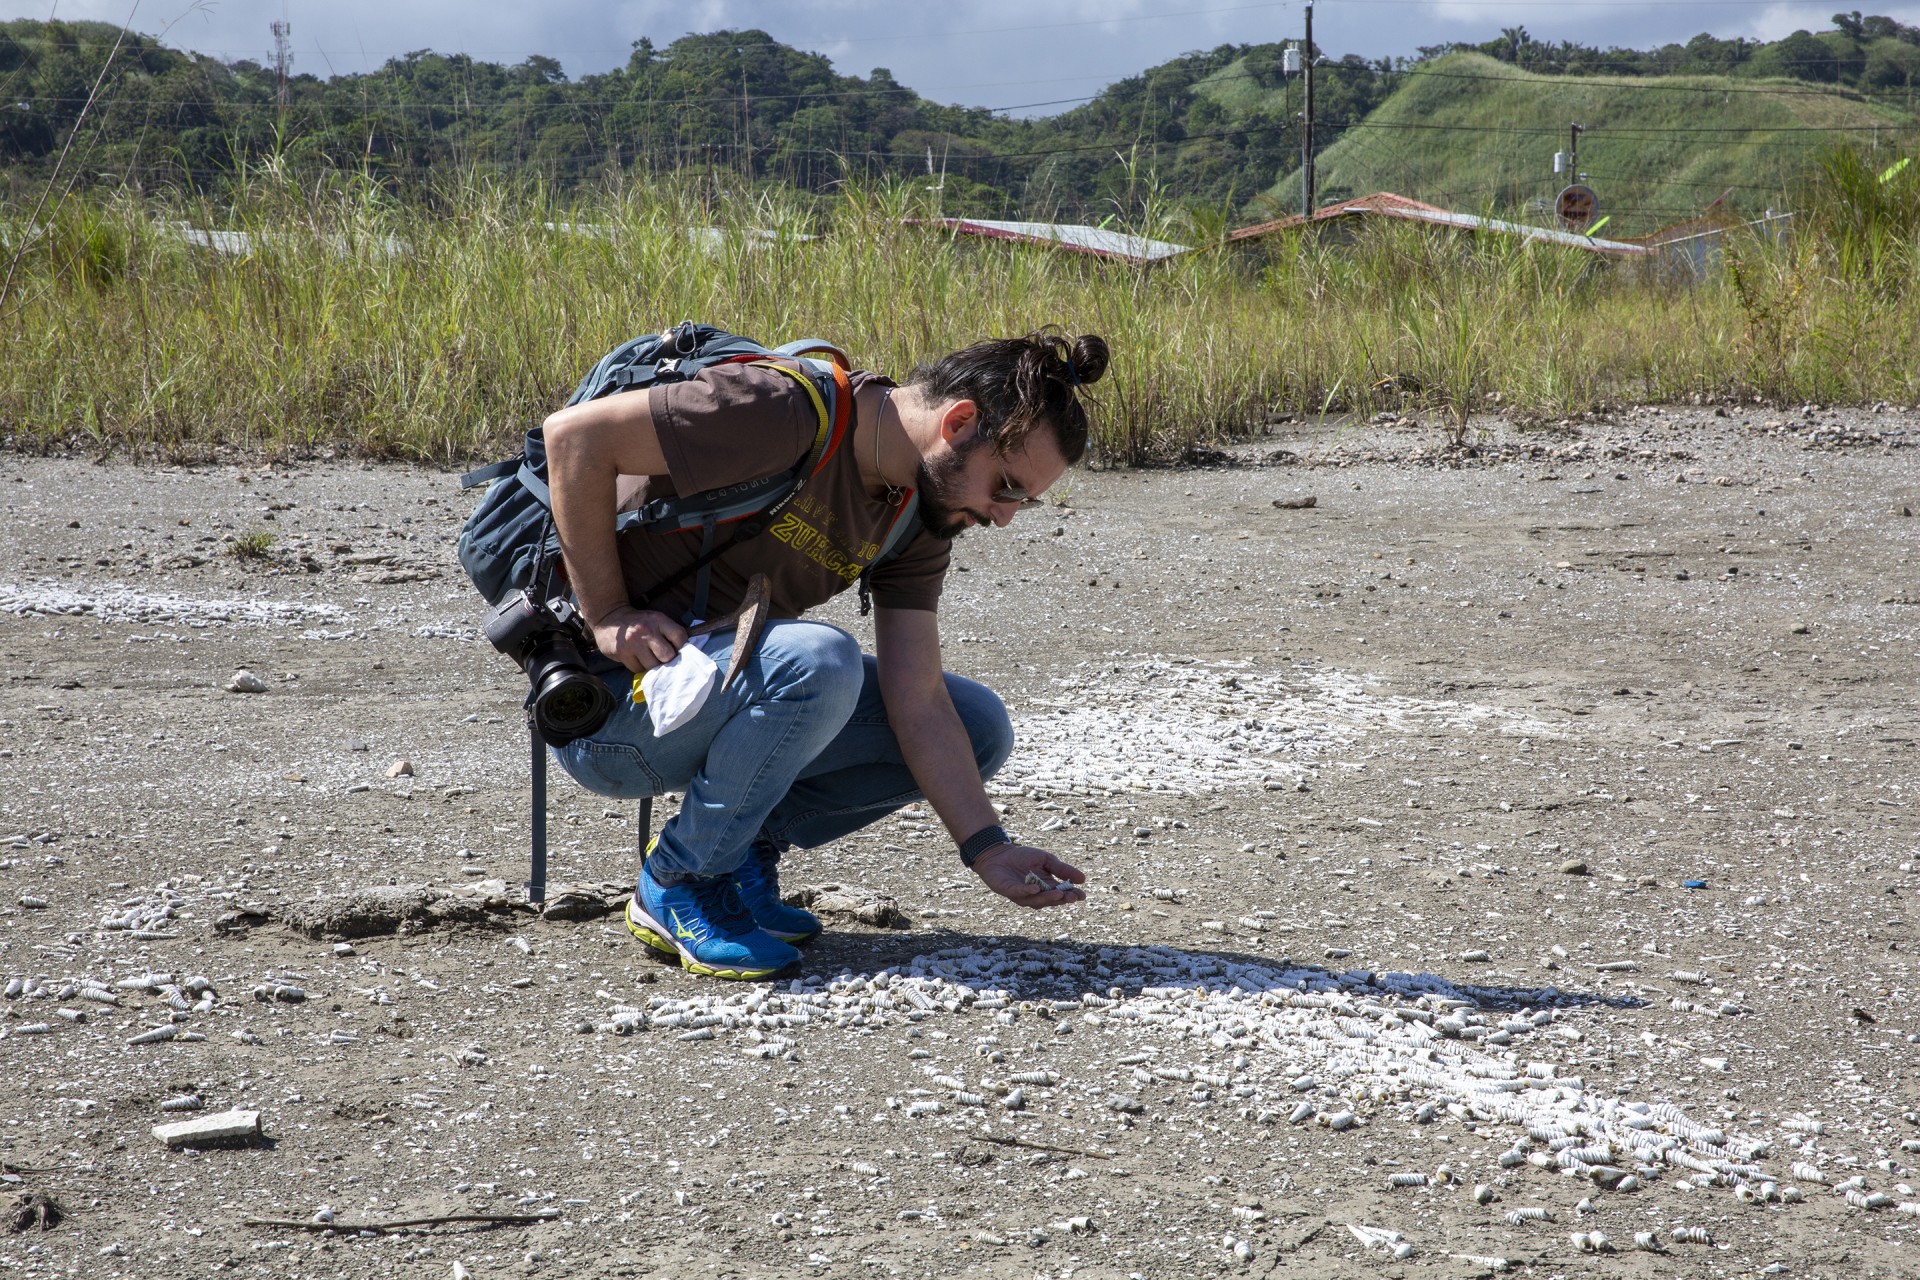
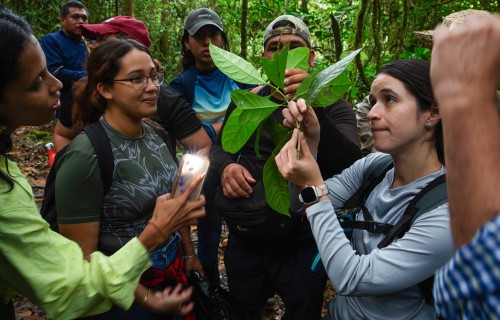
A.Murat Eren (Meren), assistant professor at the University of Chicago during a field trip for participants in STRI’s 2019 Marine Microbiome workshop. Credit: Jorge Alemán.
“Under a mountain of data, microbiologists may find it difficult to see patterns,” Jarrod Scott said. “Humans are good at identifying patterns because patterns contain useful information. Anvi’o is our eyes into the microbial world. A biologist can tell you a lot from a picture of a forest; they don’t need to complicate it with a bunch of Latin names or by talking about pinnately compound leaves. Anvi’o is our way of creating pictures of complex microbial systems.”
Anvi’o, which stands for Analysis and Visualization of ‘Omics Data, consists of more than 100,000 lines of computer code that helps researchers reconstruct microbial communities from DNA sequences. To understand how it works, try this puzzle. Put the following phrases into an order that makes sense:
- “20 minutes. Combine the rice with the vinegar, oil, sugar and salt.”
- “as Don Quixote saw them, he said to his squire: ‘Fortune is guiding our affairs better than we could have hoped. Look”
- “saucepan combine with water. Bring to a boil, turn down the heat and cook for”
- “Rinse the rice in a strainer until the water runs clear. In a medium”
- “Just then, they discovered thirty or forty windmills in that plain. As soon”
- “over there, Sancho Panza, my friend, where there are thirty or more monstrous giants with whom I plan to do battle.”
The phrases sort into two sets or bins: The “cooking instructions” bin contains phrases 1,3 and 4. The “Don Quixote” bin contains phrases 2, 5 and 6. Based on sentence structure and word order, it is easy to put the phrases in order: “Cooking instructions,” 4, 3, 1 and “Don Quixote,” 5, 2, 6 to create meaningful stories. Pretty straightforward, right?
Now imagine the leviathan task of sorting through millions of phrases like the ones above from a huge library of shredded books. And your goal is to put all of the books back together. This situation is analogous to what microbial ecologists face when they study environmental microbes. But instead of sorting words and sentences into books, microbial ecologists need to sort DNA sequences and genes into genomes. The environment is the library, and the microbial genomes are the books. You see, in order to study these microbes, cells must be broken open to liberate the DNA. In the process, DNA strands shatter into small pieces and all mix together—a huge library of shredded genomes—and the goal is to put the genome back together.
DNA sequences consist of strings of base pairs (A’s, G’s, C’s, and T’s) that code for genes. Genes in turn are translated into amino acids sequences that give rise to proteins---the biomolecules cells need to live. The complete collection of genes comprise an organism’s genome.
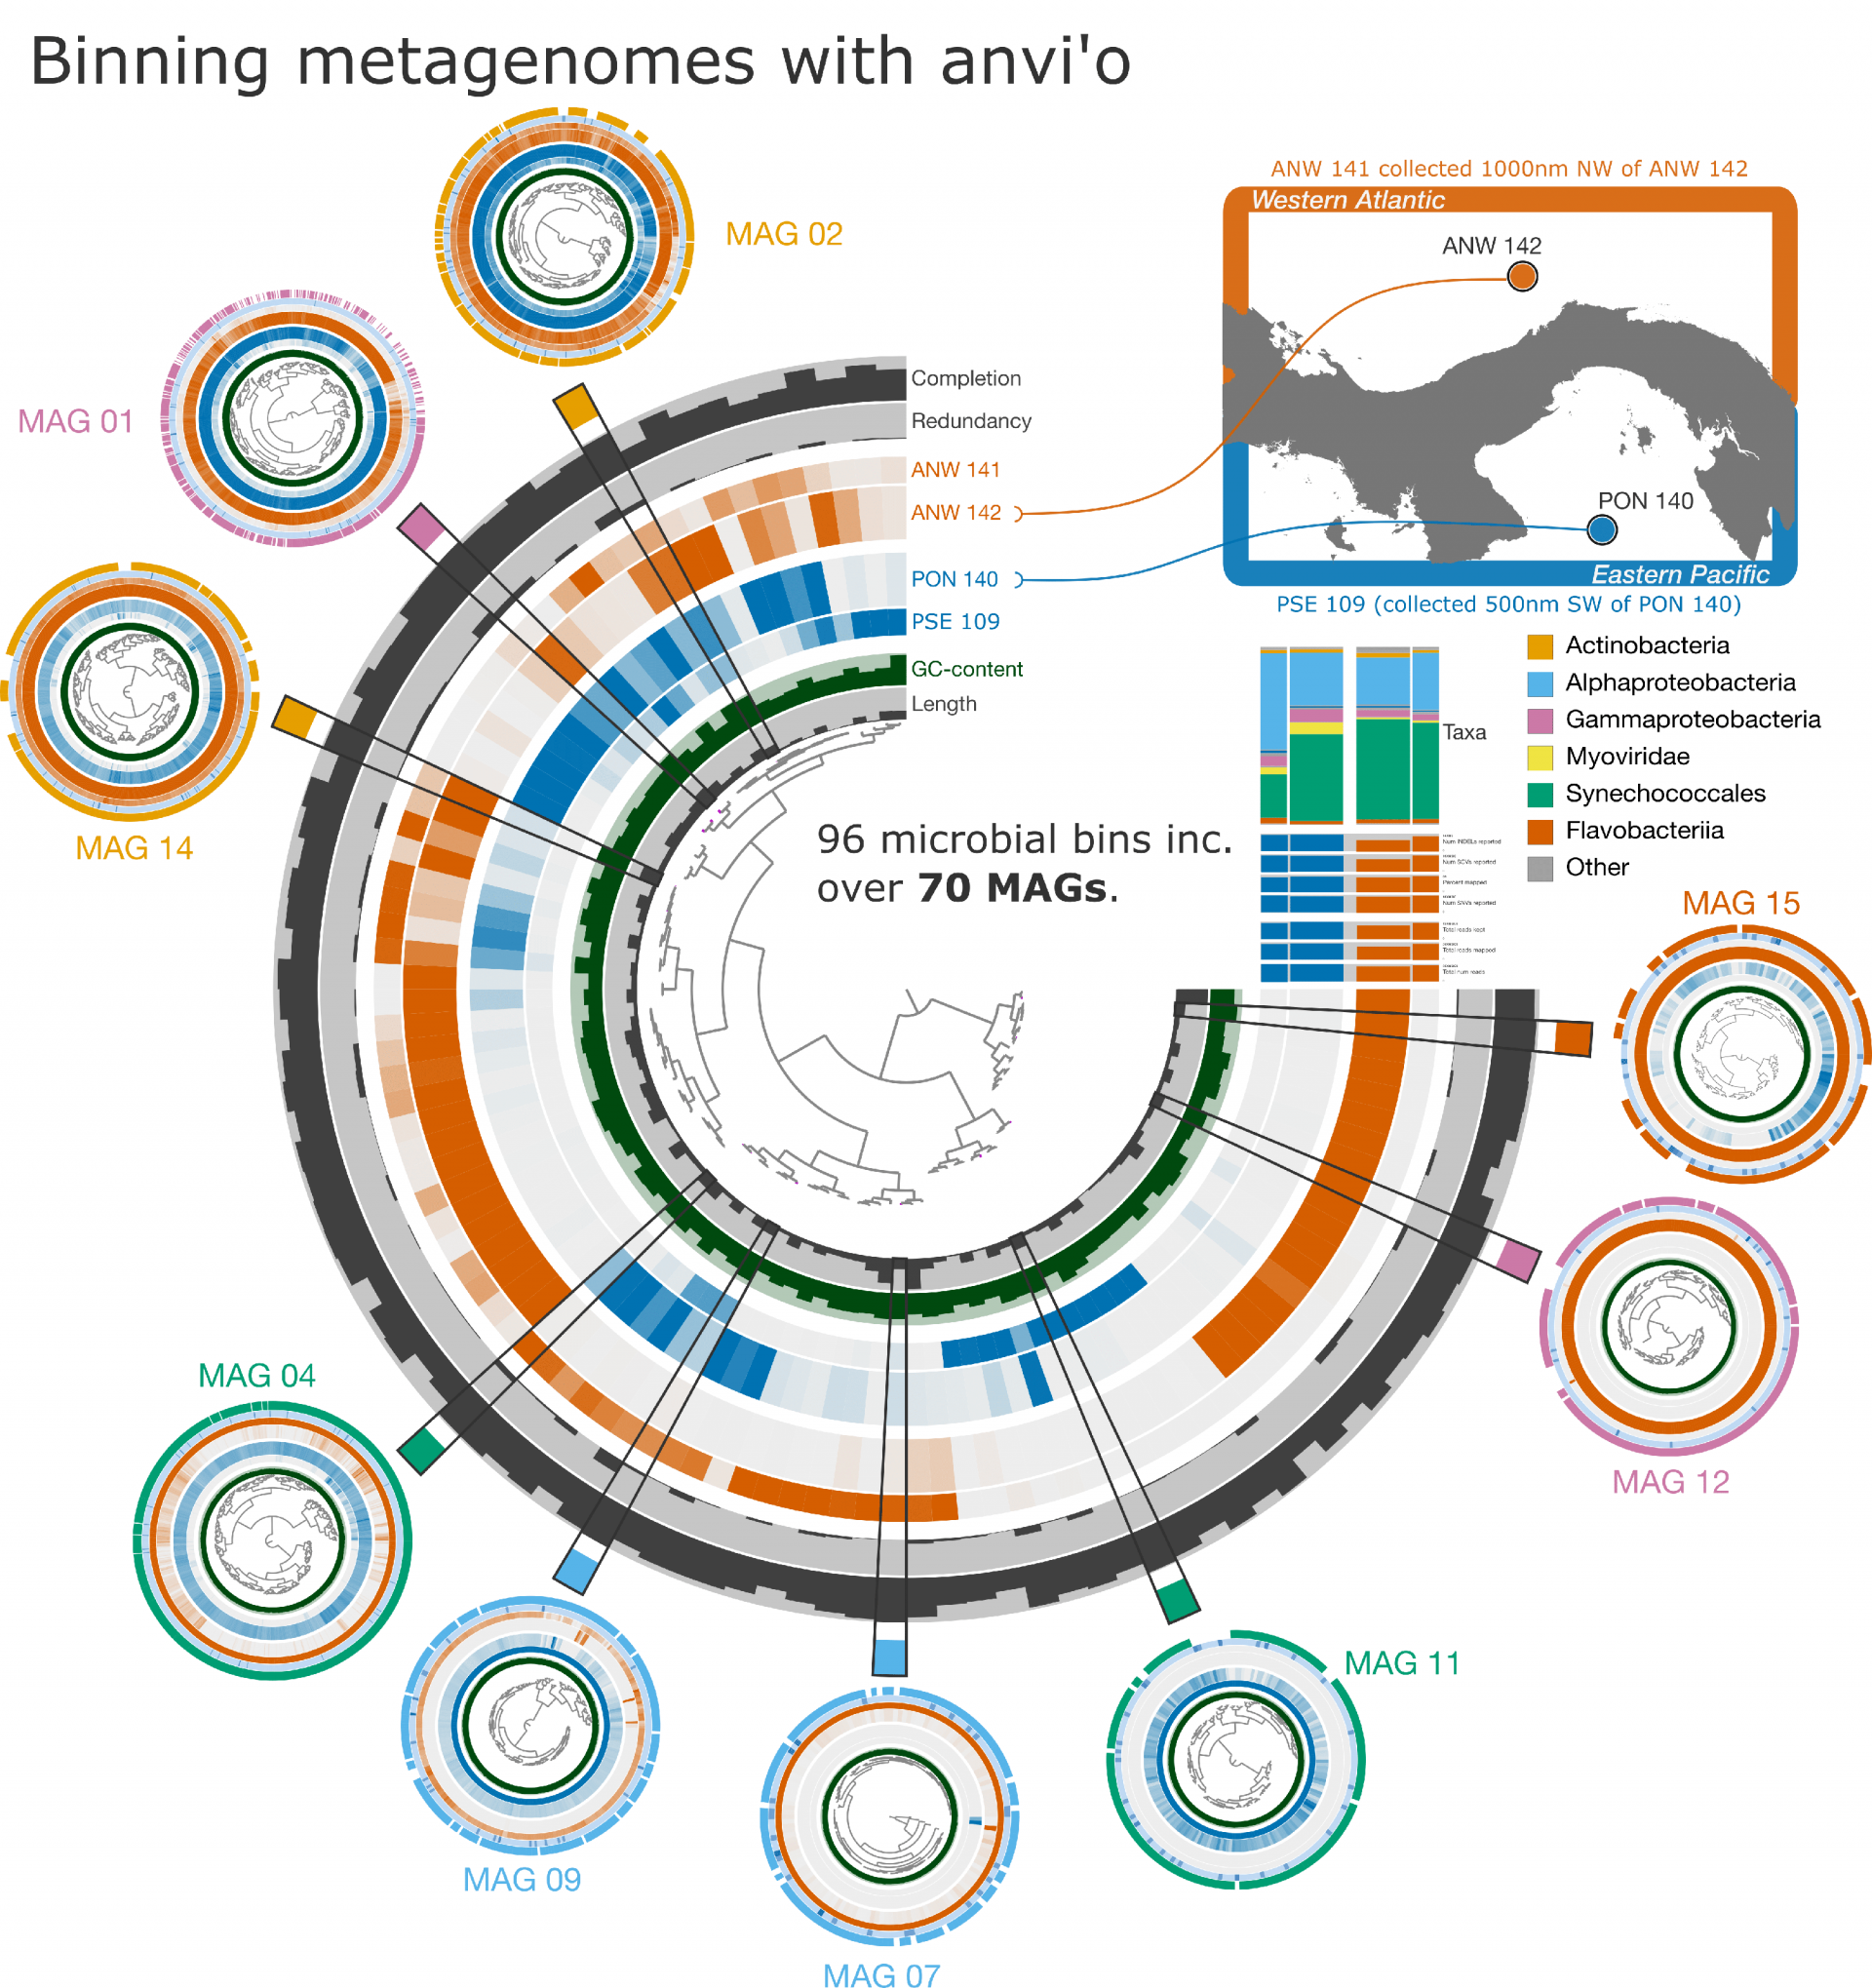
Each ring (center image) represents a metagenome sample, color-coded by the ocean where microbes were sampled. Spokes within the ring indicate distinct microbial bins generated from co-assembling the metagenomic data. Color intensity denotes bin abundance within a sample. The goal of co-assembly and binning is to rebuild microbial genomes into metagenome-assembled genomes, or MAGs. Example MAGs are shown in the smaller circles. For a description of the data used in these analyses, please see the note below.
“One thing we do when we try to rebuild genomes is we look for housekeeping genes, a subset of genes that most bacteria have. The more of these we find in a bin, the more confident we are that we have a complete genome,” Jarrod Scott said. “Following the book analogy, it’s like if we have the title page, the page with the copyright, index, main text, a set of references, and a table of contents, we know we have the whole book.”
A phrase, or sequence, of DNA code from an environment could come from any of thousands of different organisms: whales and sharks to bacteria and viruses. In our little puzzle above, we used content and context to group and order the fragmented sentences to create meaningful stories. By comparing DNA sequences to each other and to databases of known organisms, researchers can group these pieces of DNA into distinct bins; the whale bin, the shark bin, and bins representing different fungi, bacteria, and viruses. Easier said than done: this is where anvi’o has revolutionized the field of microbial ecology.
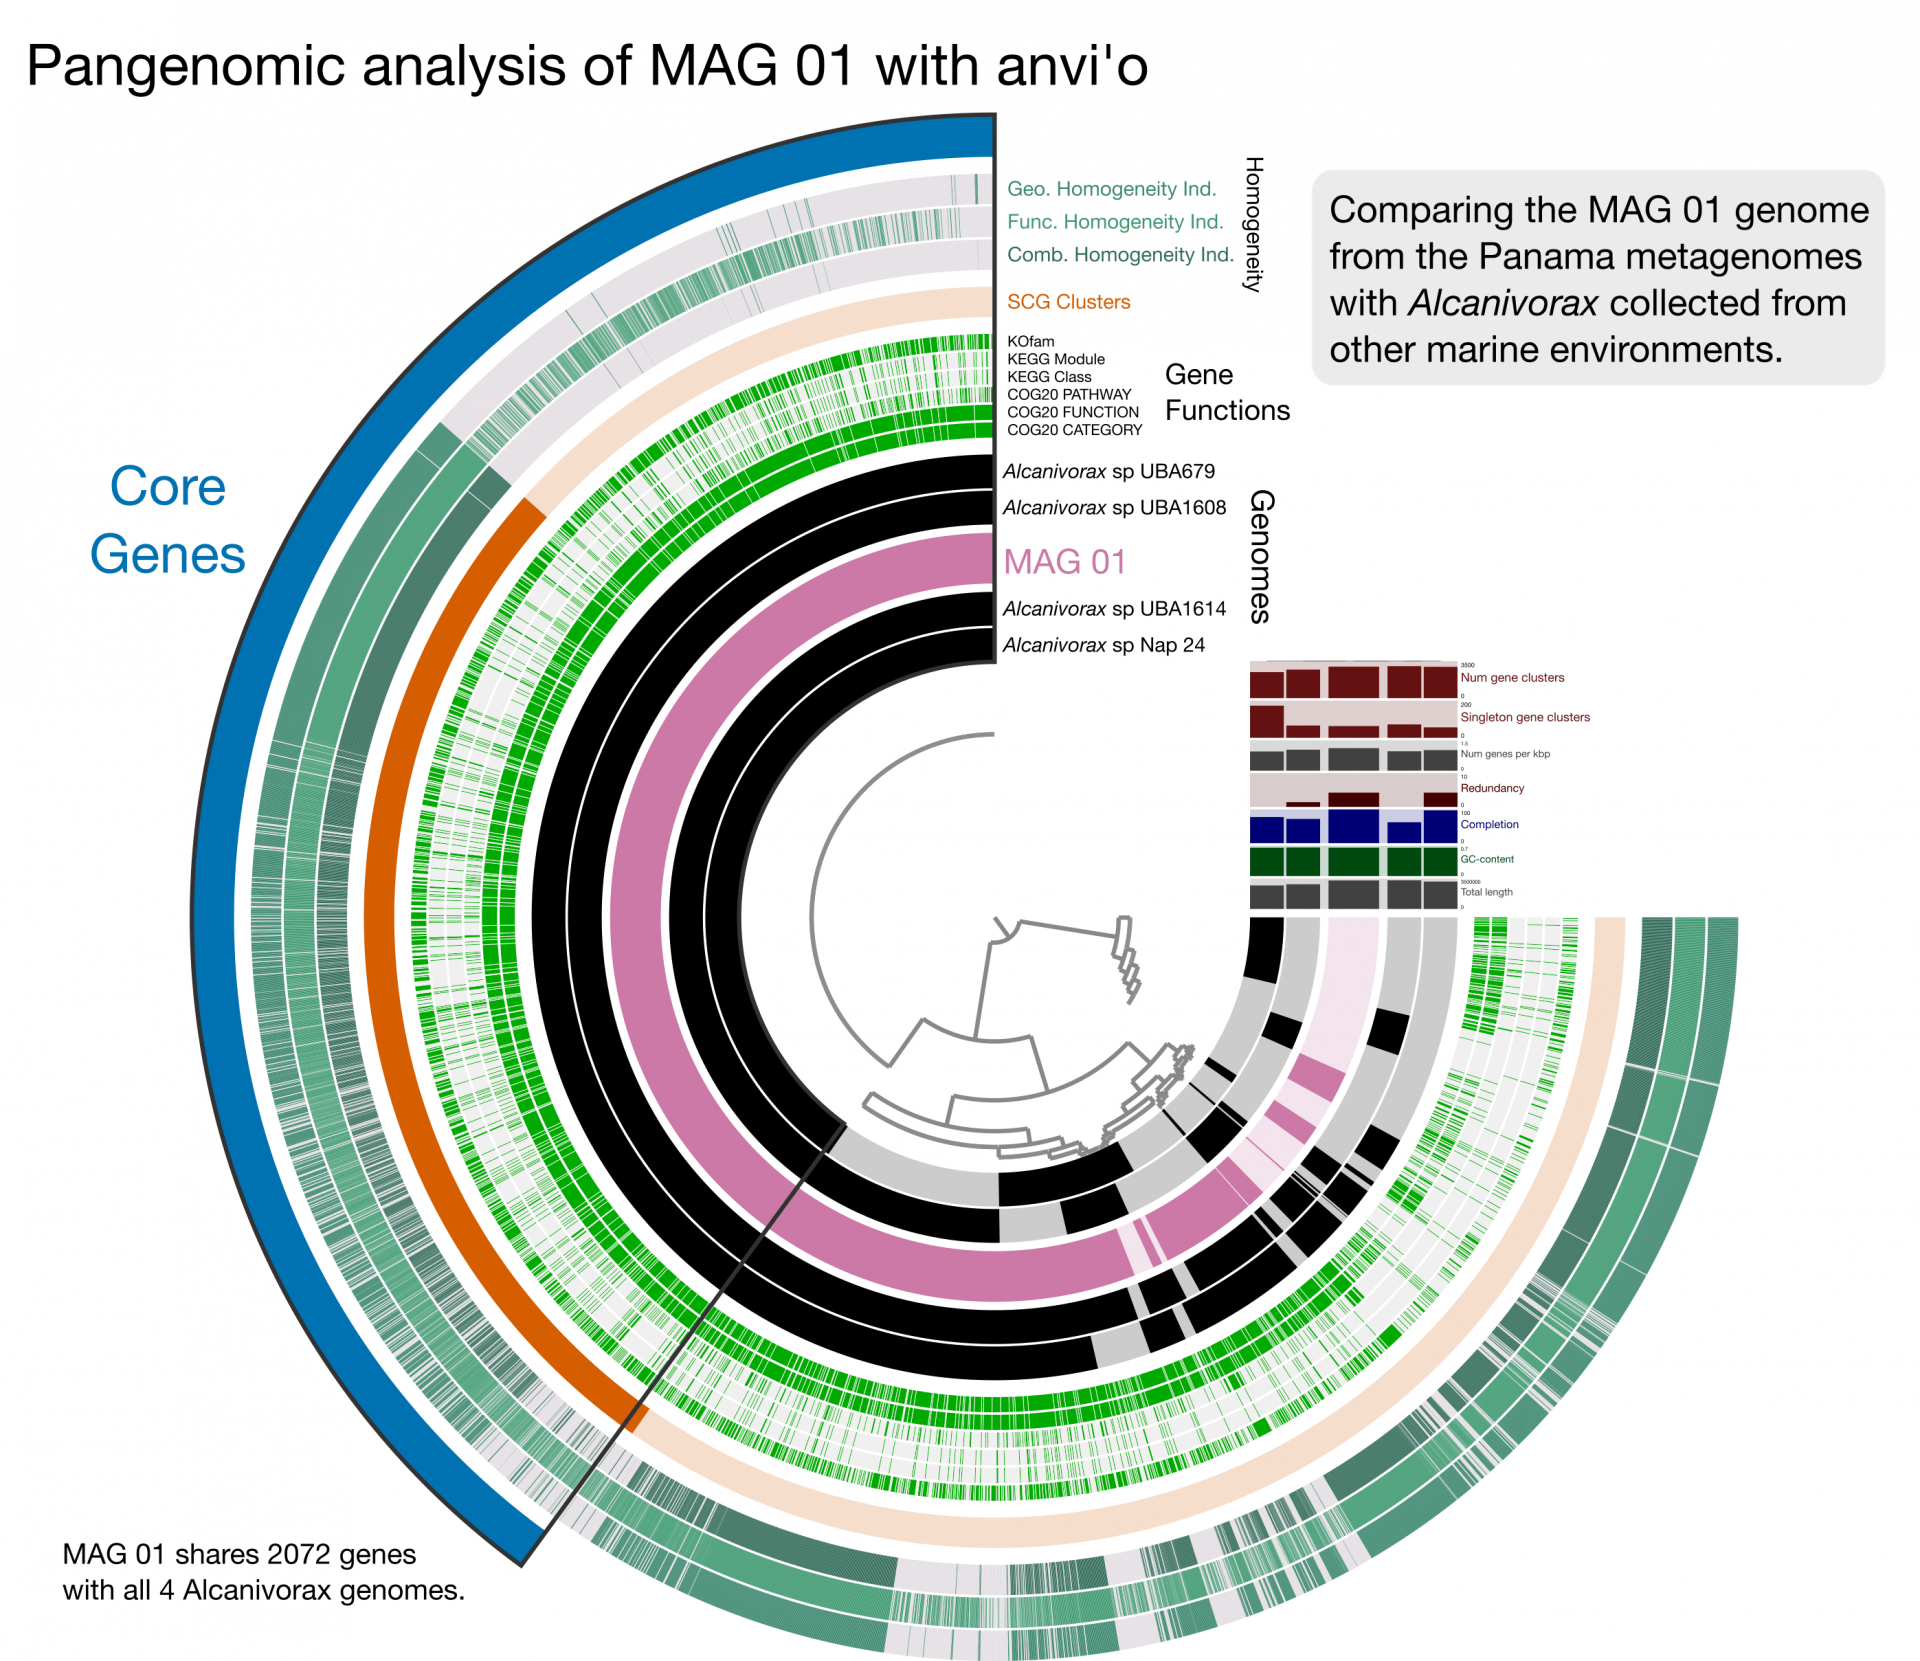
To determine which genes are shared by all genomes and which genes may be specific to a particular habitat or environment, researchers start by comparing the DNA sequences in their samples to sequences in large data bases containing known DNA sequences from many different organisms in order to determine the genus and species identification of each meta-assembled genome or MAG. MAG-01, abundant in both oceans, may represent Alcanivorax, a common marine microbe. Here, a pangenomic analysis is used to compare MAG-01 to related genomes from public data bases. In this case, each ring represents genomes, and the spokes represent gene clusters. Color indicates the presence of a gene cluster.
The authors of a new paper about the history, evolution and community development of anvi’o in Nature Microbiology use a cooking analogy to describe the way the software lets the chef, in this case a microbiologist, create visual images of data. The software lets researchers interchange different modular workflows (mix all of the dry ingredients, then add the wet ingredients) to see how that changes the result. Anvi’o also gives people the artistic freedom to change the colors, labels and order of information they present to create clearly understandable representations (see the images in this story for examples).
Anvi’o is an ecosystem of over 140 interconnected tools that helps researchers disentangle microbial diversity. As Meren is fond of saying, “anvi’o lets you get your hands dirty”. Anvi’o provides users with an enhanced experience and as much analytical freedom as possible, including extensive interactive visualization capabilities that allow users to explore these data in ways not previously possible.
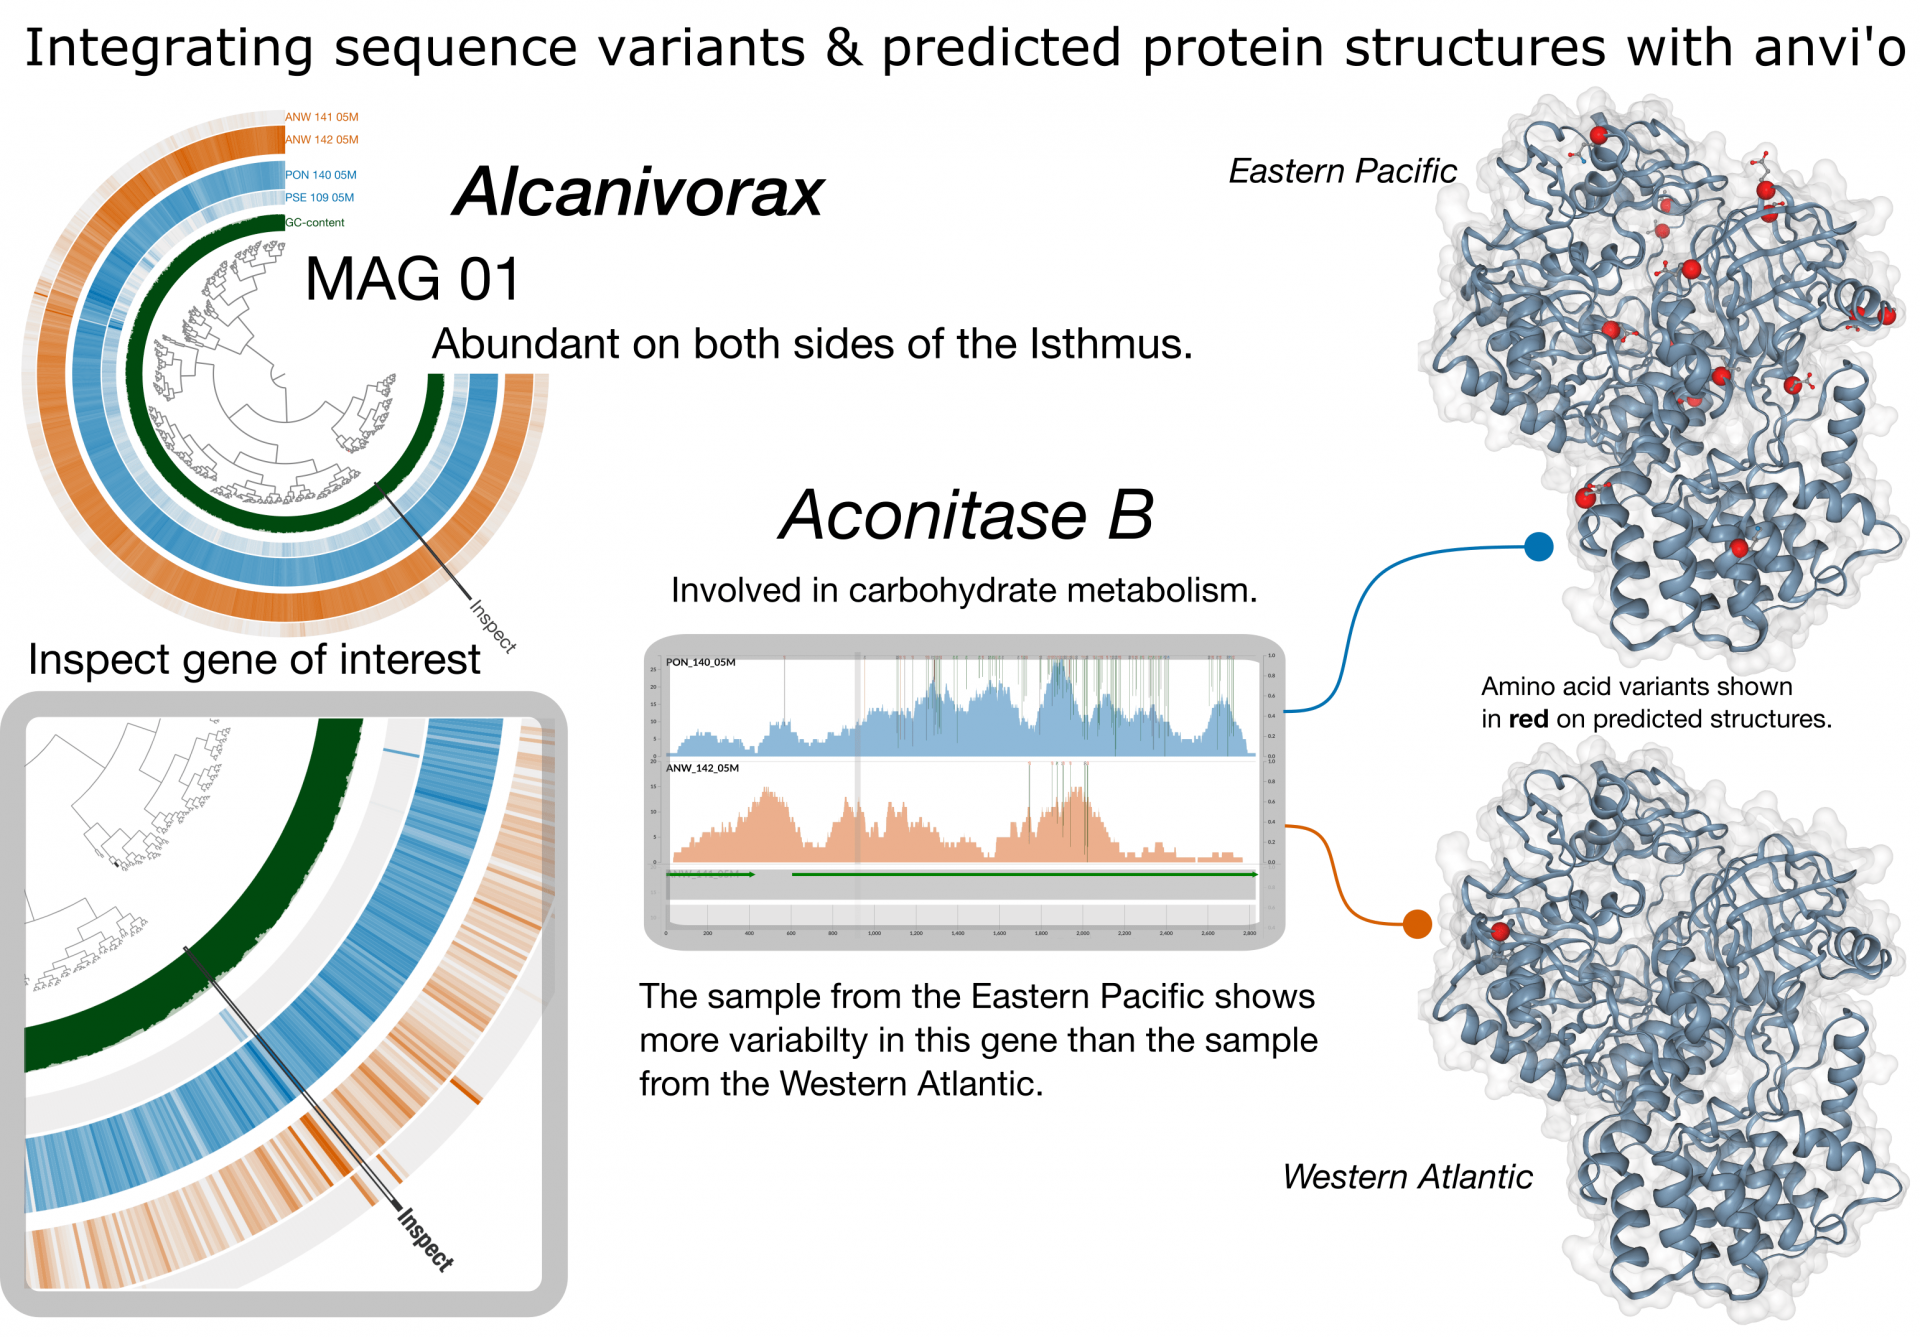
Though MAG-01 is abundant in both oceans, the Eastern Pacific and Western Atlantic differ dramatically in their geochemical and physical properties. One way to understand how the environment may shape genome evolution is to inspect gene-level variability profiles (e.g., codons or amino acids). The profile shown here indicates greater variability in the Eastern Pacific metagenome. Variable residues are then mapped onto the predicated structure of the resulting protein. Changes in amino acid sequence can alter the shape of a protein, and such changes may influence the protein’s function.
An ever-widening community of scientists contributes to improving anvi’o as a tool: people who study viruses, informatics, astrobiology, microbes in hot springs, antibiotic resistance genes, and even the tardigrade genome! Versions of the program are named as a small tribute to important women scientists; the current version is named after Hope E. Hopps, an infectious diseases specialist who along with colleagues developed a vaccine for rubella.
Jarrod Scott is among the twenty-plus authors on the paper because he is an active contributor to the anvi’o community. He met Meren in 2015 and is now working at the Smithsonian in Panama on a big project using anvi’o to understand how acute hypoxia (low oxygen) affects near-shore marine ecosystems. He is also using anvi’o to compare marine microbial communities from the Western Atlantic and Eastern Pacific areas of Panama. Scott is even creating an interactive bony fish phylogeny in anvi’o using a previously published tree (Betancur-R et. al., 2017) and data he scraped from FishBase for each species. “That’s the beauty of anvi’o” Scott said. “It is not only for microbial analyses, you can use it for many different types of data.”
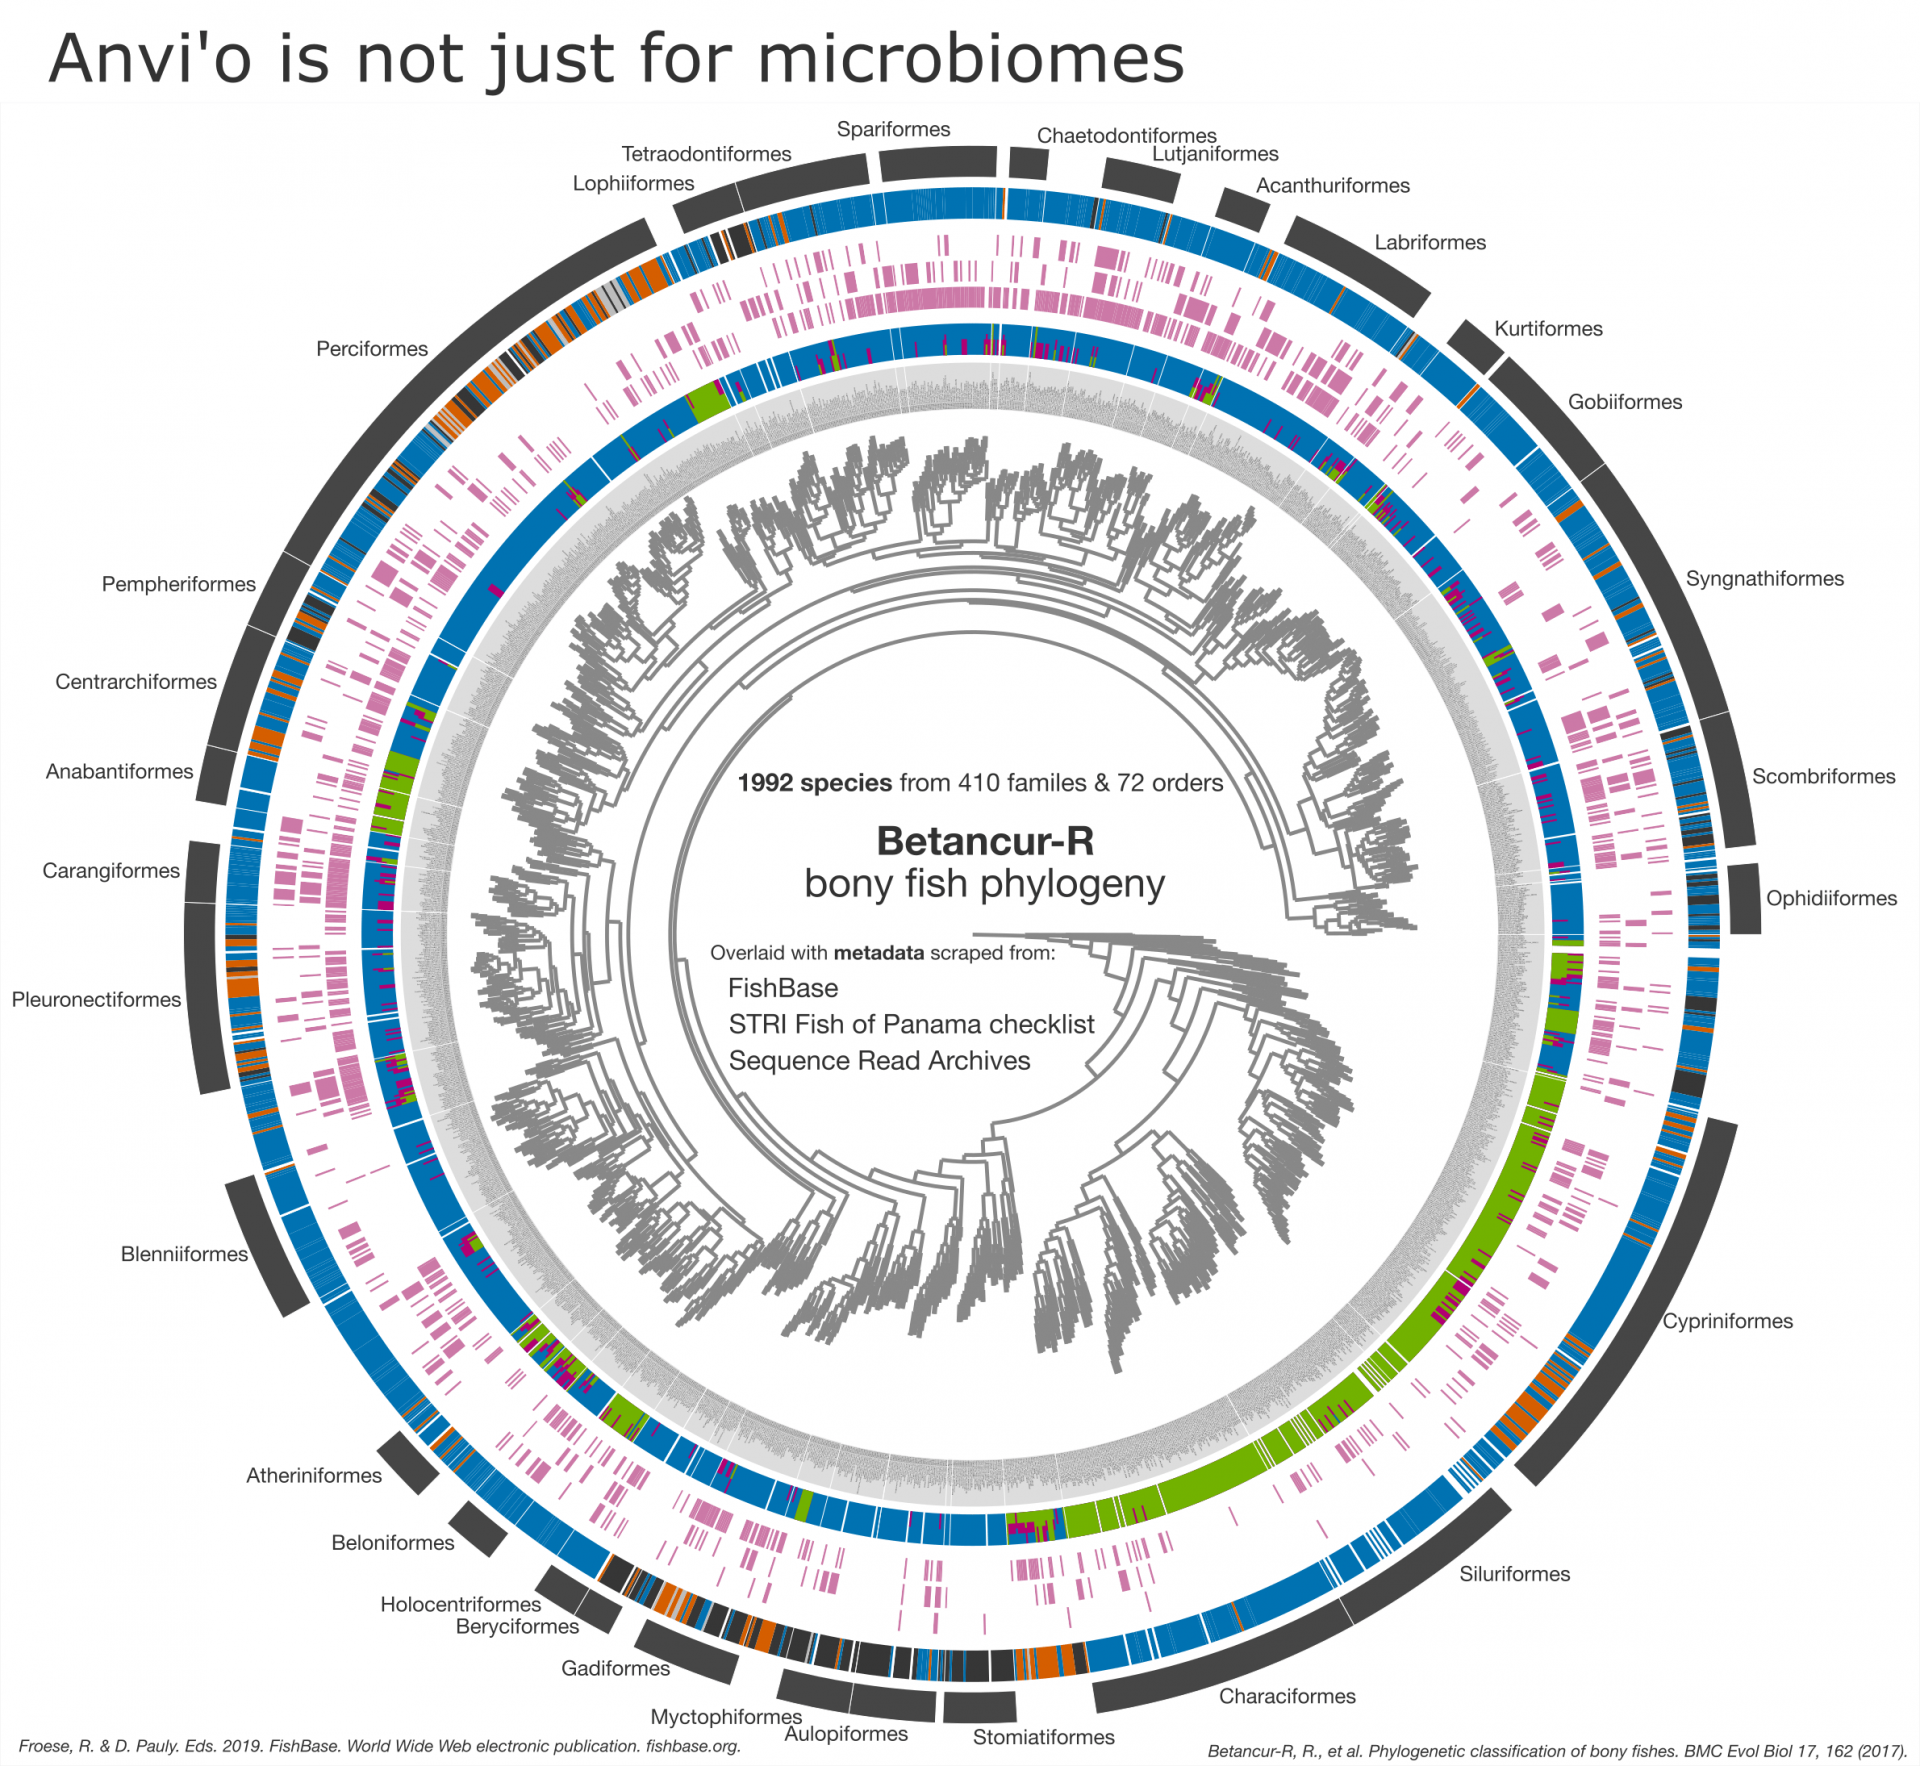
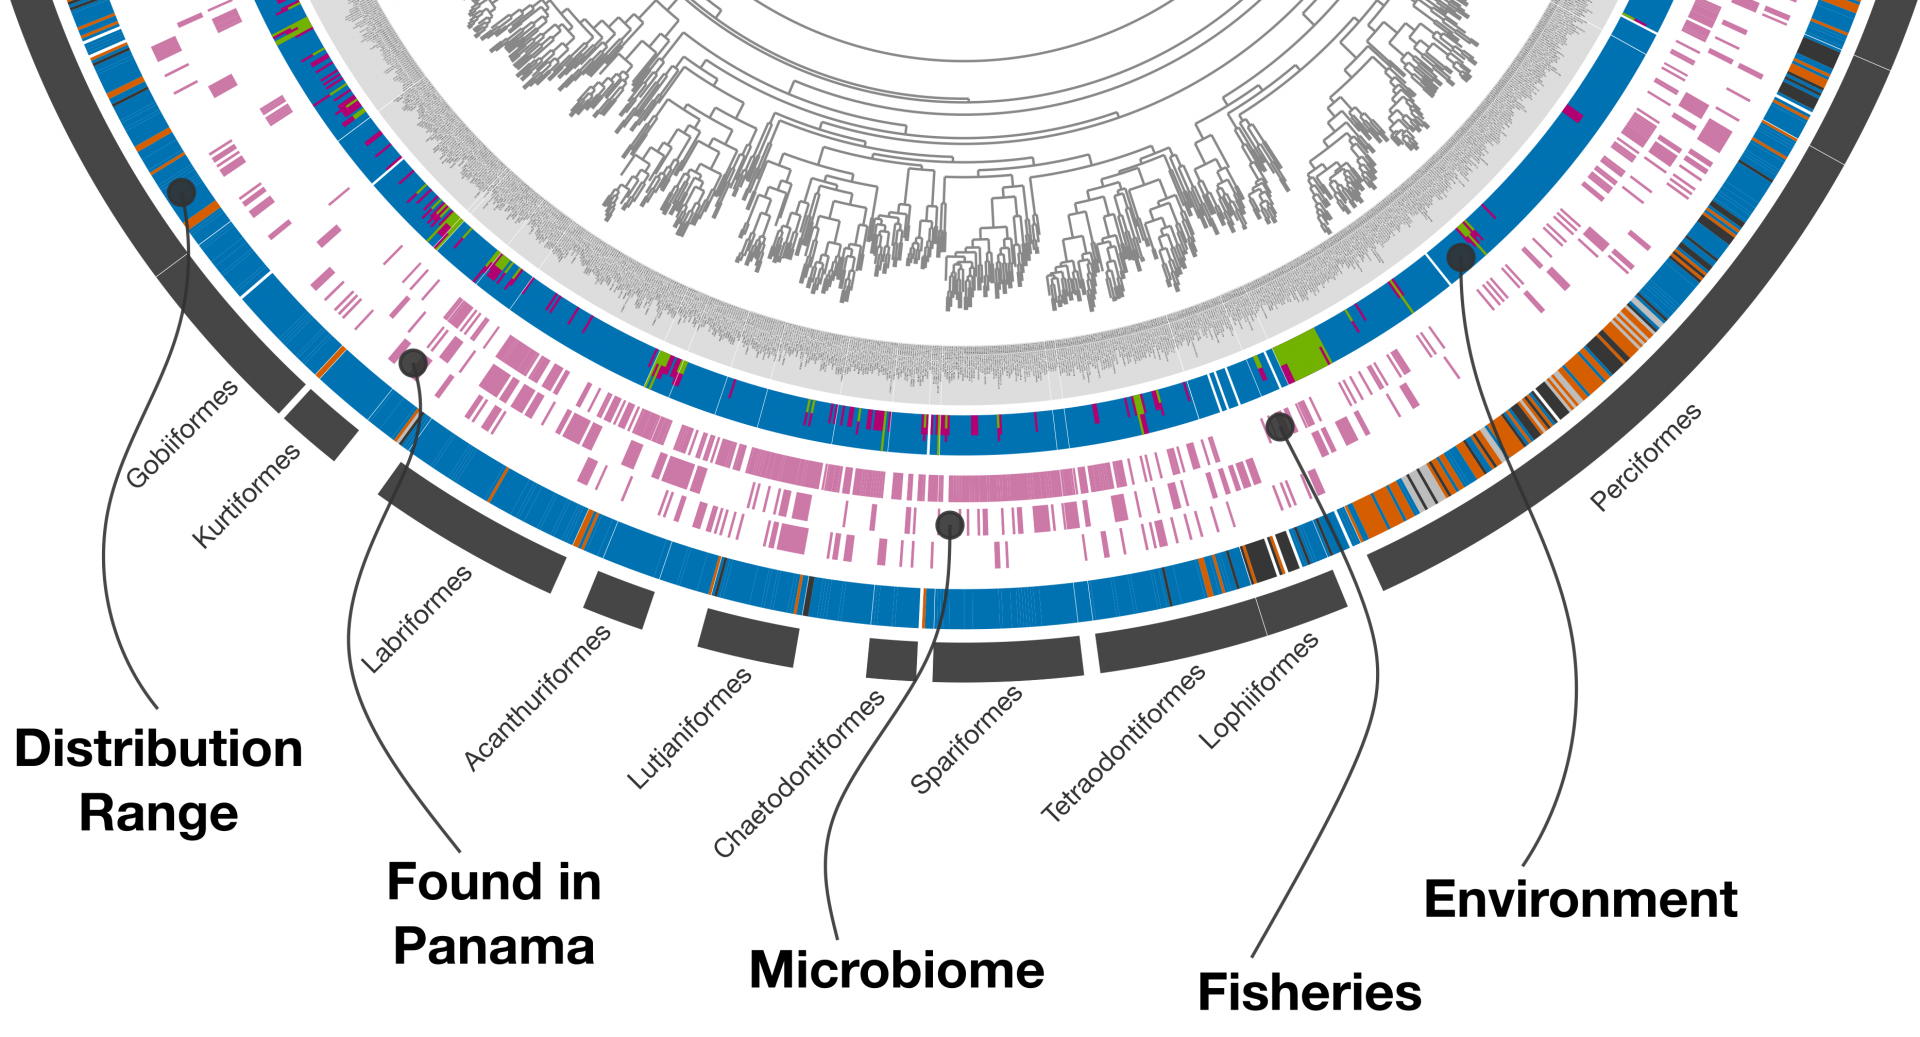
Metagenomic analysis sits at the core of anvi’o but thanks to its extensive visualization capabilities, anvi’o can be used for many other data types. Here, a previously published phylogeny of bony fish by Betancur-R et. al. (2017) is combined with metadata scraped from FishBase, NCBI's Sequence Read Archive (SRA), and STRI’s Fish of Panama checklist. Individual rings encompassing the phylogenetic tree at the center denote specific pieces of metadata.
“You can tell that Murat Eren is a serious computer coder because he wears bands on his fingers,” said Jorge Aleman, STRI graphic designer, who met Meren at STRI’s Punta Galeta Marine Laboratory, during the 2019 Marine Microbiome Workshop sponsored by the Gordon and Betty Moore Foundation and the Smithsonian Office of the Provost's One Smithsonian Symposia Program.
“Make no mistake, anvi’o has a steep learning curve, but it’s worth the tears you will shed.” Jarrod Scott said, “Members of the Meren lab and external contributors have written extensive tutorials that make learning anvi’o more approachable and fun. In fact, I would recommend these resources to anyone working with ‘omics data, whether they are experts already or newcomers to the field.” The Meren lab also maintains a very active anvi’o Slack site with over 700 members where people can get help from the community.
Web scraping resulted in over 40 pieces of species-level metadata properties. For simplicity, only 5 are shown. Starting at the outermost ring, the Distribution range denotes where the species is found (tropical, temperate, deep-water, etc.). Found in Panama indicates whether fish has been recorded anywhere in Panama. Microbiome (fish genus level only) indicates whether microbial sequence data was found in the SRA. Fisheries contains information on whether a fish is used for food, from highly commercial to subsistence fisheries. Environment describes whether the species lives in freshwater, brackish, and/or marine systems.
A note on the microbial data used in the examples above: Between 2009 and 2013, DNA from bacteria, viruses and other microbes was collected at over 200 sampling stations from all of the world’s oceans during the global Tara Oceans Expedition (Sunagawa et. al., 2015). The expedition collected microbial DNA from sites in Panama’s Western Atlantic (WA) near the port city of Colón and from the Eastern Pacific (EP) in the Bay of Panamá. In this piece, we analyzed a small subset of these samples using anvi’o to demonstrate how it helps us visualize and explore microbial communities. Please note, this analysis is for demonstration purposes only. For a more rigorous and comprehensive analysis of Tara Oceans microbiomes, please see the amazing 2018 publication by Delmont and colleagues.
Eren, A.M., Kiefl, E., Shaiber, A. et al. Community-led, integrated, reproducible multi-omics with anvi’o. Nat Microbiol 6, 3–6 (2021). https://doi.org/10.1038/s41564-020-00834-3

